Docs
Client reports
A monthly PDF report tells your client how their sites did: availability, speed and outages, written for someone who is not technical. Every number comes with a sentence that explains it and a verdict in words, so your client does not have to ask what 99.649 % means.
Reports are part of the Agency plan and above.
What is in a report
- Cover. The client's name, the month, how many monitors were checked and from how many locations, and availability for the month. With your branding set up under Settings → Branding, the report carries your logo, name and colour instead of ours.
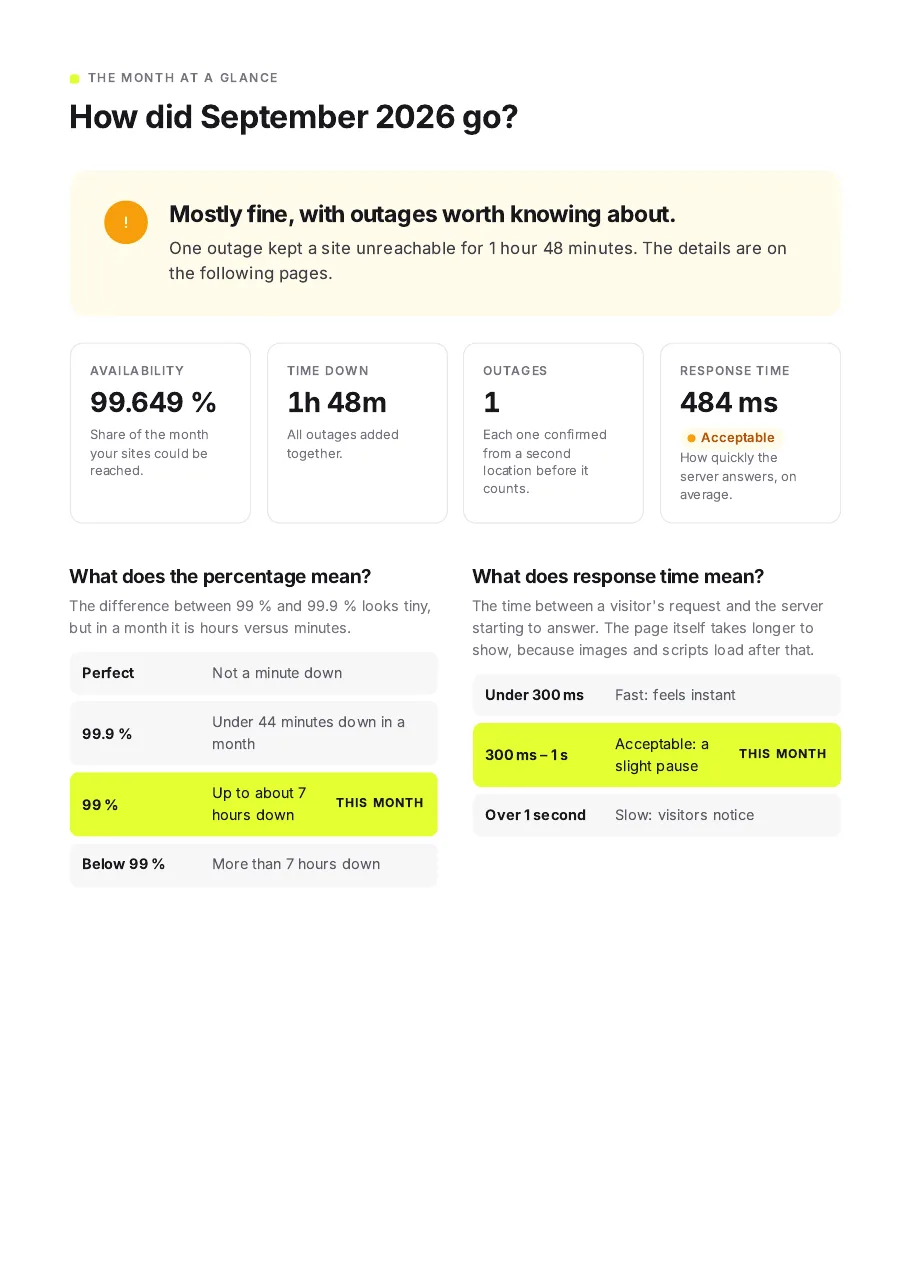
- The month at a glance. One sentence that sums up the month ("Everything worked all month.", "Mostly fine, with outages worth knowing about.") and four numbers: availability, time down, outages and response time. Below them, two scales show where this month falls: what 99 % and 99.9 % mean in hours and minutes, and what counts as a fast or slow server.
- Site by site. For every monitor, availability and response time day by day: each square is one day, green without an outage, amber with a short one, red with an hour or more. Notes you added on the timeline appear here as numbered pins above their day.
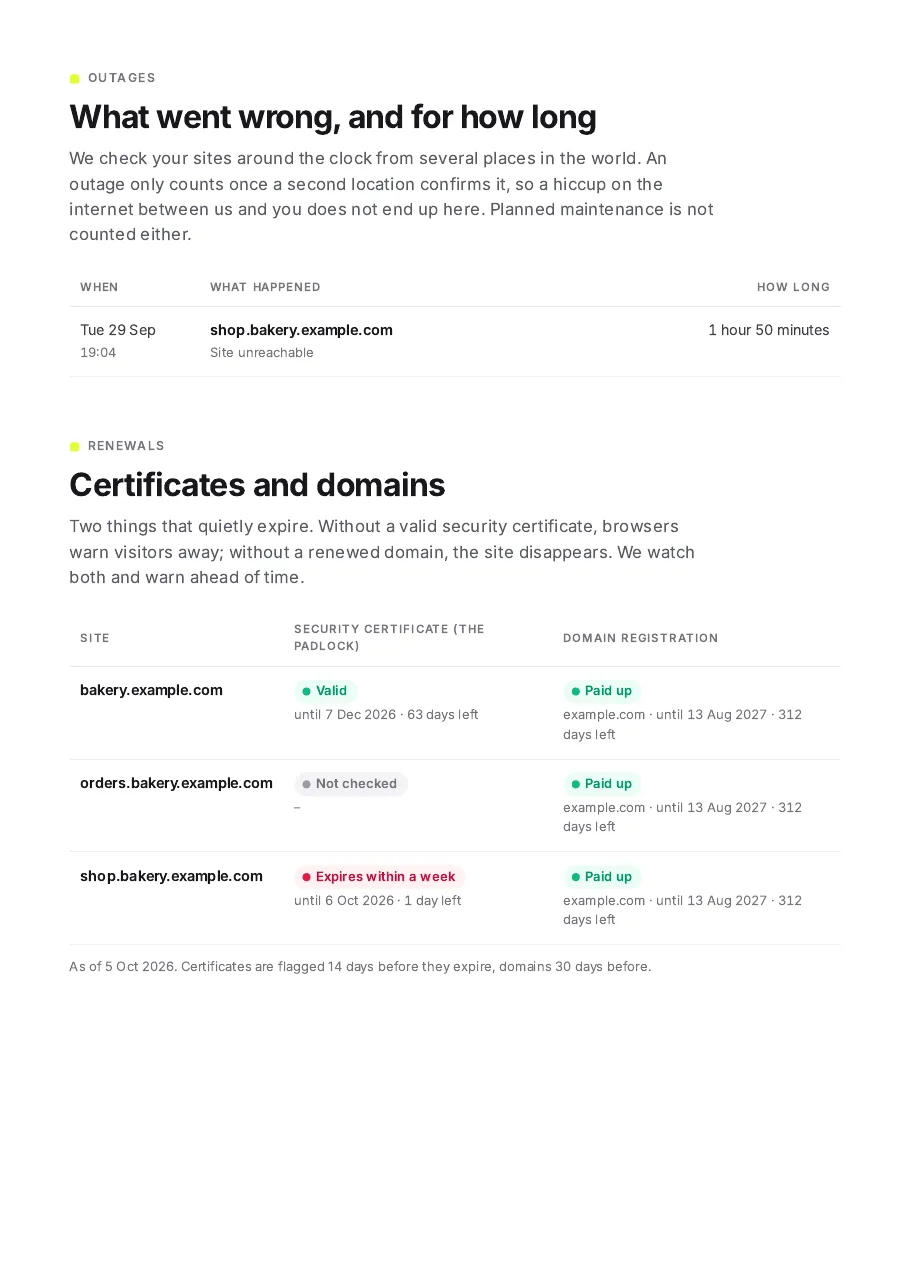
- Outages. When each outage started, what happened, how long it lasted and, if you wrote one down, its cause.
- Certificates and domains. Each site's security certificate and domain registration, with the date they expire and days left.
Example
A report for a client with three sites, for September. The month at a glance:
Outages, certificates and domains:
What counts
The numbers in a report are the same as everywhere else in PulseKeeper:
- Only confirmed outages count. A failed check that a second location did not confirm never reaches a report. See how outages are detected.
- Maintenance windows are left out. Planned work is not an outage and does not lower availability. See maintenance windows.
- Response time is the server's answer, not how long the whole page takes to load. Page speed from Google PageSpeed is a different measurement and is not in the report.
Adding context: causes and notes
A report shows what happened. Two things let you tell your client why.
The cause of an outage
On the Incidents tab of a monitor, open a confirmed incident and click Add cause. Write a short sentence, up to 280 characters, for example "outage at the hosting provider, fixed on their side".
- The cause appears next to the outage in the report and in the client portal, as Cause: ….
- Untick Show in client report to keep it for your team only. You can switch it either way later with In client report / Internal only under the cause.
- You can write it while the outage is still going on, and change it at any time. Clear the text to remove it.
- Adding or changing a cause sends no alert and does not change the incident.
Note: A cause written after a report was created is not added to that report. For last month you can create the report again on the Clients screen (see below).
Notes on the timeline
On the Insights tab you can add a note at a point in time, such as "moved to a new server". It shows as a numbered line on the response time chart and, with In report ticked (the default), as a numbered pin in the report, with the list of notes below the chart.
Deploys from deploy tracking can appear there too, but only the ones you switch on with In report: your commit history stays yours unless you choose to share a deploy.
When reports are sent
On the morning of the 1st of each month we create last month's report for every client with at least one monitor, and email it as an attachment to everyone who has access to that client's portal.
To set it up, open Clients, click Manage next to a client and add the people who should get it. Under Monthly reports you can also:
- create last month's report straight away with Create report for …, for example after adding a cause. A report for a month that already exists is replaced;
- download any of the last 12 reports, and see whether each one was emailed.
Your clients find the same reports in the client portal under Monthly reports. A report is a file: it does not change after it is created, so the numbers your client sees in December are the ones they got in September.
Language
Each client has its own language, set under Language in the same panel. The report and the email it comes with are in that language, with dates and numbers formatted for it (99,649 % in Slovenian).
Exporting to CSV
For your own records, or to paste into an invoice or a monthly summary, you can download the same events as a spreadsheet: open the target, click Report and then CSV next to the month. If the target has several monitors, tick Only … first to export just the one you are looking at.
The file has one row per event, in time order:
| Type | What is in it |
|---|---|
| Incident | Start, end, duration in minutes, monitor, what happened, severity, whether it is resolved, and the cause if it is marked for the client report |
| Note | When, and the note, if it is marked In report |
| Deploy | When, the update line from the report, the commit message, commit, branch and author, if the deploy is marked In report |
It contains exactly what goes into that month's report and nothing more: suspected outages, internal causes and notes or deploys not marked for the report stay out. Times are in your team's time zone, with the offset, so a spreadsheet does not read them as UTC.
CSV export is part of every paid plan, the Solo plan and above.
Tip: If Excel shows everything in one column, use Data → From Text/CSV and pick comma as the separator.
A report for one target
You can also download a report for a single target, without a client: open the target and click Report at the top. Pick the month (the current month shows so far), and if the target has several monitors, tick Only … to report on just the one you are looking at.
You can go back up to 12 months, as far as your plan keeps history. This report is not stored and not emailed: it is created when you ask for it, for you to send on.