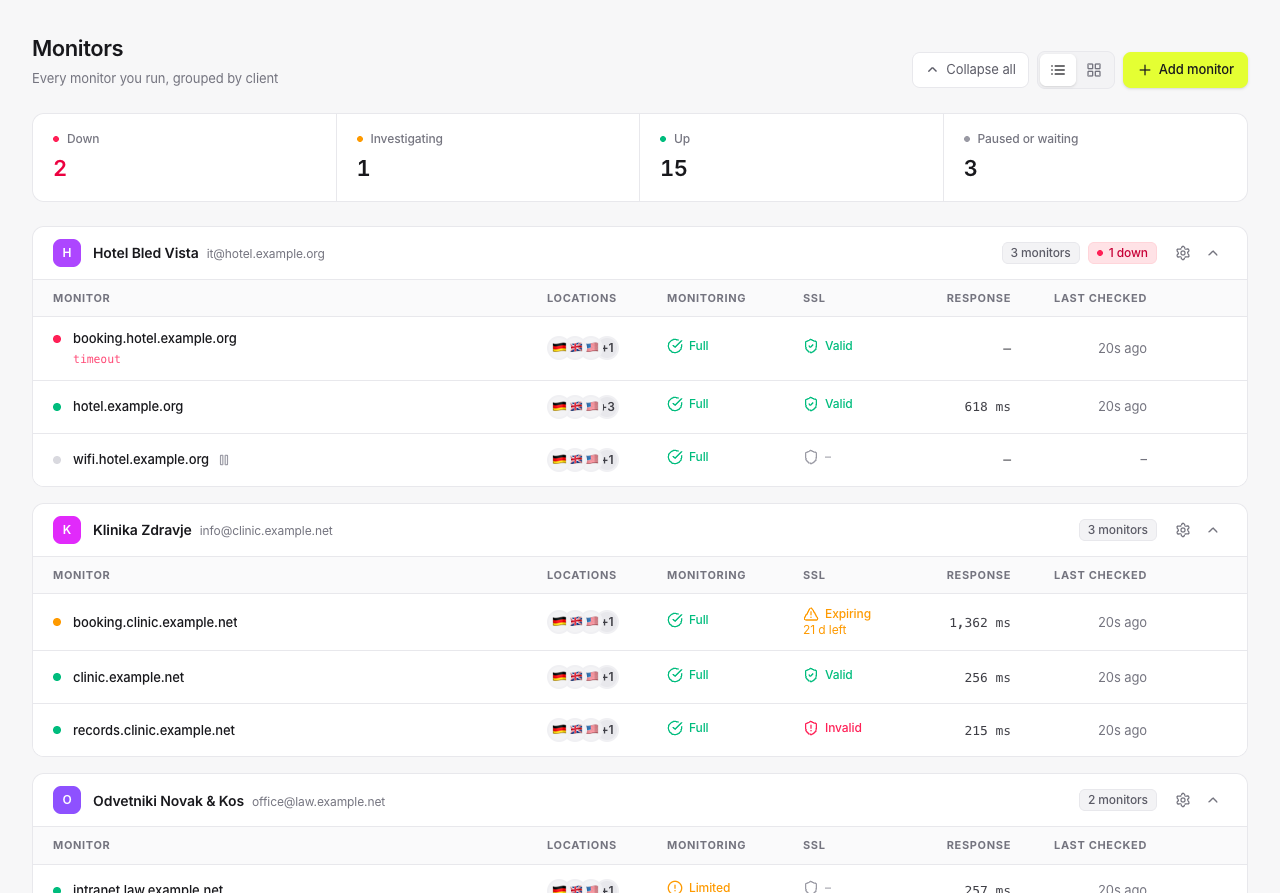
Websites over HTTP and HTTPS, any TCP port (databases, mail, SSH) and ping. One failed check is a suspicion; an incident needs other regions to agree, so a dropped packet in Frankfurt never wakes you.
A failure is verified from two other healthy regions immediately. Only when they agree does it become an incident, and only then does anyone hear about it.
A TCP port only opens a connection and sends nothing. Ping goes through the system ping. db.example.com:5432 and your homepage are two monitors on one target.
A target that has never answered is shown as "never connected", with one notice and no incident. Your uptime report is not ruined by a hostname you mistyped.
Server response time on every check, split by region, with p50, p95 and p99: the average hides exactly the requests people complain about.
Our own regions are watched too: when one of our probes goes silent, that is our problem and it does not open an incident on your monitors.
Performance monitoring
Response time per location and page load from PageSpeed
Deploy tracking
Every deploy measured before and after
SSL & domain expiry
Certificates and registrations, weeks ahead
DNS history
What changed in your DNS, and when
Alerts
Email, Slack, Discord, Telegram and webhooks, without spam
Status pages
One public page for all of a client's services
Maintenance windows
Planned work that does not page anyone
No card, no trial countdown. Add a monitor and it starts being measured before you finish reading this sentence.