Know when it's down. And when it's slow, and what changed right before it.
Free plan · No credit card required
- GitHub
- GitLab
- Bitbucket
- Slack
- Discord
- Telegram
More than "is it up?" PulseKeeper tracks whether it works, how fast it answers and when that changes, from 3 regions.
One check, every signal
- HTTP / HTTPS
- API
- TCP port
- Ping
- Cron heartbeats
- SSL certificate
- Domain expiry
- PageSpeed
Response time, next to your deploys
from ProEvery push to the branch you deploy from is measured from every location and compared with the hour before it.
One monitor. More coverage.
- SSL certificate Included
- Domain expiration Included
- DNS history from Pro
- Page load & Core Web Vitals (PageSpeed) from Pro
- Security headers Coming soon
Supporting checks don't take another monitor slot.
A website can be online and still be getting worse. PulseKeeper keeps the history, so gradual slowdowns and sudden regressions both show up.
Response time
Server response time on every check, from every location you monitor from.
Page weight after deploys
After a deployment, Google PageSpeed measures the page again: JavaScript, CSS, images and fonts, compared with the run before it.
Page load & Core Web Vitals
Google PageSpeed: LCP, CLS, TBT, FCP and page weight by type: images, scripts, fonts.
History kept: Free 7 days · Solo 12 months · Pro 12 months · Agency 24 months
One failed check shouldn't ruin your night. When a check fails, other regions verify it immediately, before anyone is alerted.
- 🇩🇪 Frankfurt primary check Failed
- verify from other regions, right away
- 🇺🇸 New York checking… OK
- 🇺🇸 San Francisco checking… OK
- No incident
Logged as a suspicion. Nobody is woken up.
- 🇩🇪 Frankfurt primary check Failed
- verify from other regions, right away
- 🇺🇸 New York checking… Failed
- 🇺🇸 San Francisco checking… Failed
- Incident: alert sent
Every region agrees, so the alert goes out right away.
Fewer unnecessary alerts
A single failed request doesn't automatically become a production incident.
Faster confirmation
Verification runs immediately. It doesn't wait for the next scheduled check from another region.
More context
See where a check failed and whether the problem looks local or global.
Your site got slower. See which deployment it started after, with GitHub, GitLab or Bitbucket.
Correlation, not causation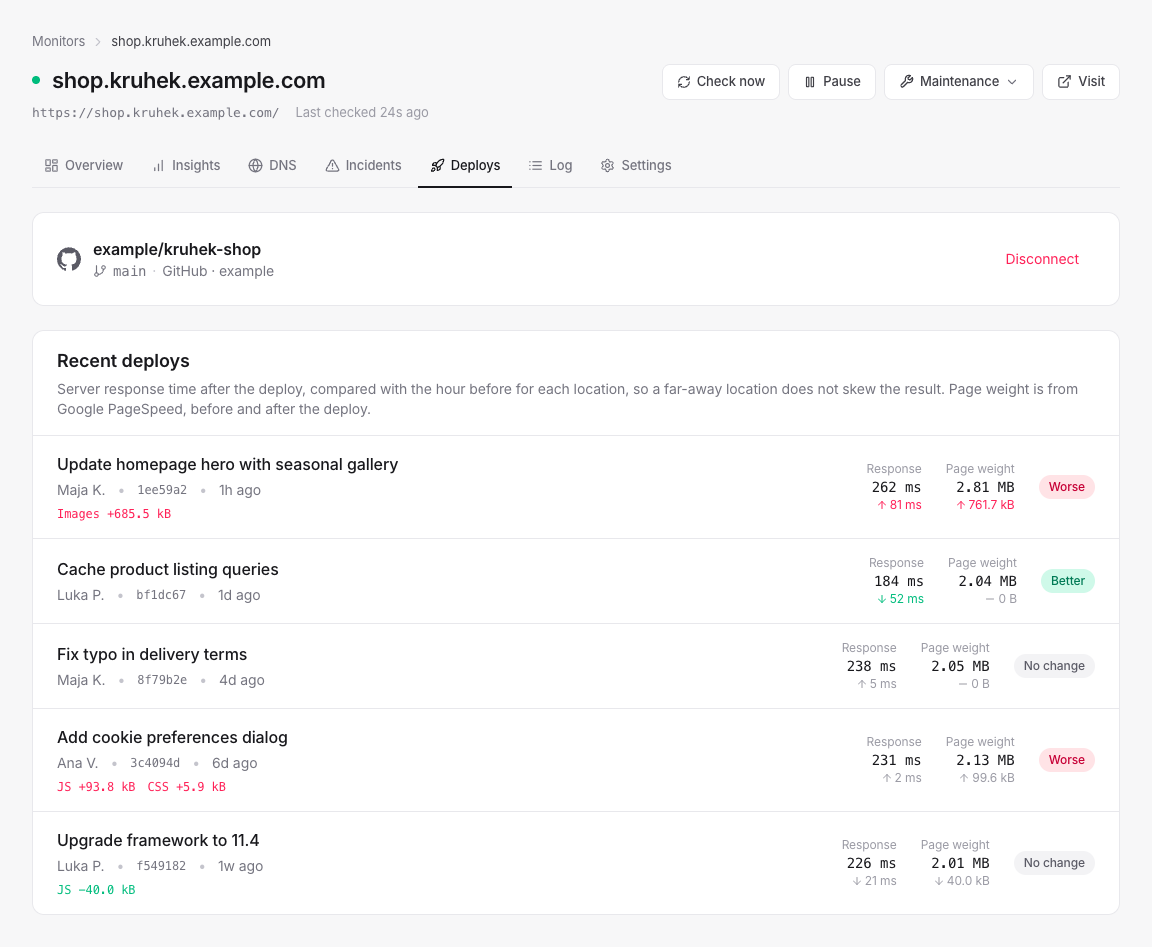
Make monitoring part of your service. Every client's websites in one place, and something they can understand.
- Monitors grouped by client
- A public status page for each client
- Up to 100 monitors
- Client logins
- Monthly PDF reports: uptime, response time and incidents
- White-label: your logo on status pages, the portal and reports
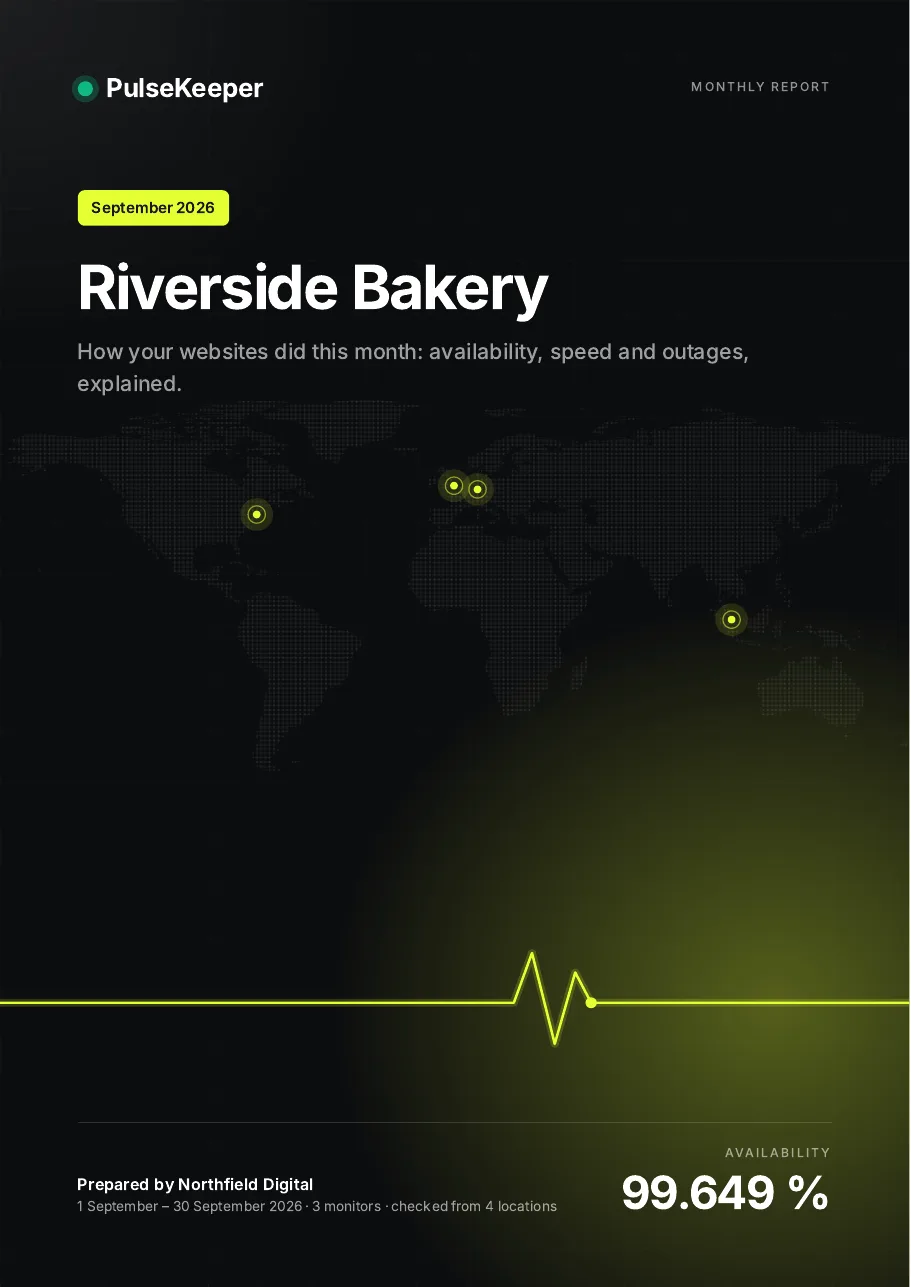
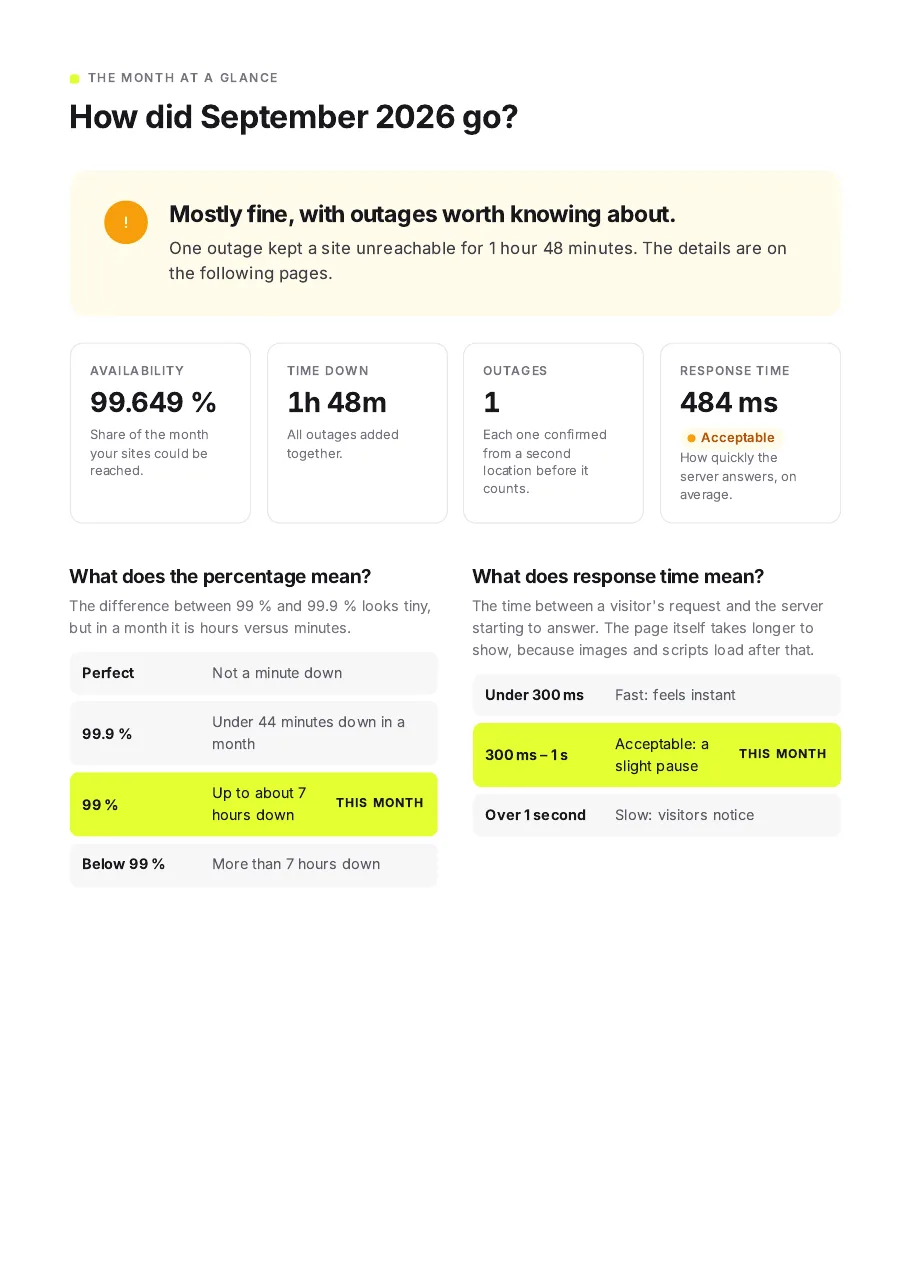
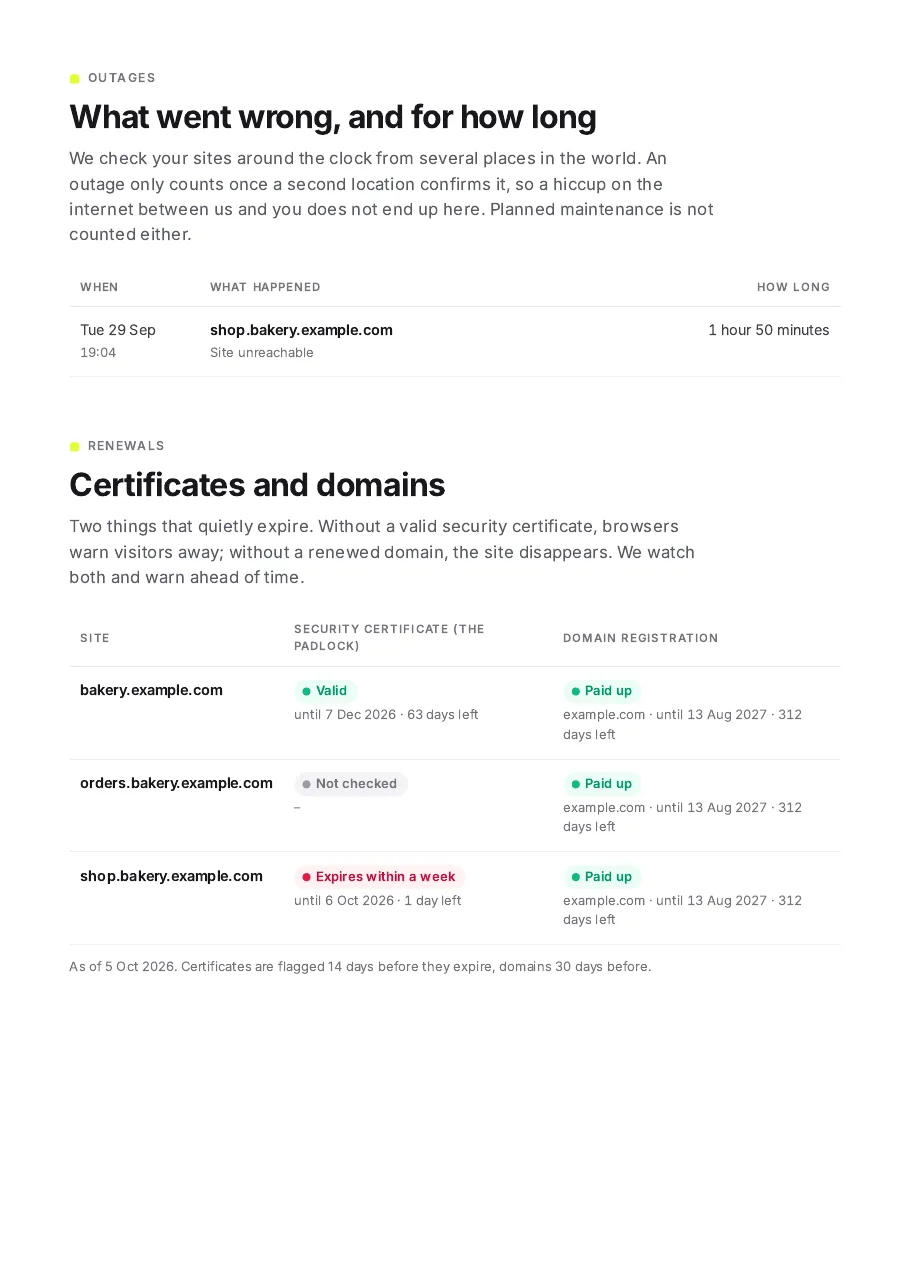
A report your client actually reads. Every month a PDF in plain language: how available the sites were, how fast they answered, what went wrong and what expires next.
Written for people who are not technical
Every number comes with a sentence on what it means and a verdict in words. What 99.9 % means in minutes, what counts as a fast answer.
In their inbox on the 1st
Created for each client on the first of the month and sent to the client logins who want it, in the client's language.
With your logo, not ours
From Agency the cover, accent and sender are yours. Need one site for one month? Export it from the site's page any time.
Simple pricing. Start with uptime and response time for free. Move up for faster checks, page speed and deployments on your timeline.
Free
For trying PulseKeeper and smaller projects.
No card, no trial clock
- 3 monitors HTTP, TCP, ping, API
- Checks every 5 minutes
- 1 monitoring location
- 7 days of history
- SSL and domain expiry on every monitor, no extra slot
- Alerts by email
Solo
For personal projects and small production setups.
€84 billed yearly
$84 billed yearly
£72 billed yearly
Billed monthly
- 15 monitors HTTP, TCP, ping, API
- Checks every 5 minutes
- 3 monitoring locations
- Failures verified from another region before an alert
- 1 year of history
- SSL and domain expiry on every monitor, no extra slot
- Alerts by email, webhook, Slack, Discord and Telegram
- Maintenance windows: planned work does not alert 1 public status page with 90-day uptime
Pro
For production teams that want to catch outages and performance regressions.
€228 billed yearly
$228 billed yearly
£192 billed yearly
Billed monthly
- 40 monitors HTTP, TCP, ping, API
- Checks every minute
- 3 monitoring locations
- Failures verified from another region before an alert
- 1 year of history
- SSL, domain expiry and DNS history on every monitor, no extra slot
- Alerts by email, webhook, Slack, Discord, Telegram and sms
- Maintenance windows: planned work does not alert Deployments on your performance timeline 1 PageSpeed run per target a day 3 public status pages with 90-day uptime
Agency
For teams monitoring infrastructure for clients.
€1,188 billed yearly
$1,188 billed yearly
£996 billed yearly
Billed monthly
- 100 monitors HTTP, TCP, ping, API
- Checks every minute
- 6 monitoring locations
- Failures verified from another region before an alert
- 2 years of history
- SSL, domain expiry and DNS history on every monitor, no extra slot
- Alerts by email, webhook, Slack, Discord, Telegram and sms
- Maintenance windows: planned work does not alert Deployments on your performance timeline 4 PageSpeed runs per target a day Monthly PDF reports for clients Monitors grouped by client, alerts per client Unlimited client logins, limited to their own monitors White-label: your logo, not ours, on everything clients see Unlimited public status pages with 90-day uptime 1 custom domain for the client portal and status pages
Prices include VAT or GST where that is customary (EU, UK, Australia). In the US and Canada, sales tax is added at checkout where it applies. Businesses with a valid VAT number are charged without VAT.
Running more than 100 monitors?
We can set up higher limits, faster checks and dedicated monitoring capacity for larger environments.
Questions. Straight answers.
What performance data does PulseKeeper track?
Every check records availability and the server response time from each monitoring location. From Pro, Google PageSpeed adds page load time, Core Web Vitals, the performance score and page weight by type (JavaScript, CSS, images, fonts) once a day and after deployments. All of it is kept as history, as long as your plan allows.
What is deployment correlation?
Connect the repository and branch you deploy from (GitHub, GitLab or Bitbucket, from Pro). Each push to that branch (or a successful GitHub deployment) appears on the monitor's timeline, is measured from every location shortly after and compared with the hour before it, and Google PageSpeed measures the page weight again. If it got noticeably slower or heavier, you get one warning on your alert channels.
Does PulseKeeper know which commit caused a slowdown?
No. PulseKeeper shows correlation, not causation: which deployment a change in response time or page weight started after. That gives your team a faster starting point for the investigation, not a verdict.
Does PulseKeeper use PageSpeed Insights?
Yes, from Pro. Each web target is measured with Google PageSpeed once a day or more, depending on the plan: load time, Core Web Vitals (LCP, CLS, TBT, FCP), the performance score and page weight by resource type, plus real-user data where Google has it. It is shown separately from server response time.
Do failed checks immediately trigger an incident?
No. On plans with more than one monitoring location, a failure is checked again from other regions right away, and an incident opens only when they agree. With a single location, it takes two failed checks in a row.
What counts as a monitor?
One active target that we check on your interval: a website or HTTP endpoint, an API endpoint, a TCP port or a host we ping. db.example.net:5432 and db.example.net:6379 are two monitors.
Do SSL and domain checks use another monitor?
No. The SSL certificate, domain expiry and (from Pro) DNS history and PageSpeed of a target are checked alongside its monitor and never take another slot.
Can PulseKeeper monitor client websites?
Yes. Agency groups monitors by client, covers up to 100 monitors, gives each client a public status page and a login of their own, and sends monthly PDF reports with uptime, response time and incidents.
Does a paused monitor free up a slot?
No. A paused monitor is not checked and does not alert, but it keeps its slot until you delete it.
Is there a free plan?
Yes. Up to 3 monitors on the Free plan, with no card and no trial clock.